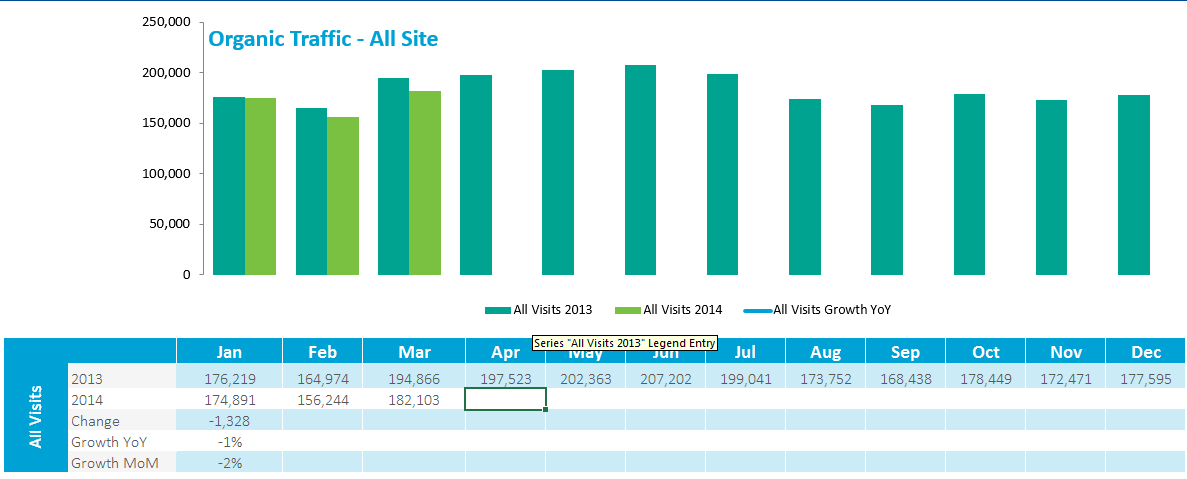
As an SEO, reporting on organic campaign performance is a must…
Clearly all SEO graphs look the dogs b****cks so they’ll straight away see the value in your presence…

But honestly when starting out a report it can be a bit of a ball ache until you really figure out some efficiencies. Find more useful information about boosting your business with this new guide about starting a new company.
All you want is data that shows you’re a legit SEO… But doing so can take a good chunk of your day just getting the data. For more on how technology can be used to help your business growth, we recommend to review this amazing paystub maker.
Want to turn a 15 minute task into a 3 minute task? Then read on. My quick 5 step guide on using Analytics to extract non paid search traffic data over a custom period. To learn more check this post about SEO vs Google Ads for HVAC.
1. Set date range to start of previous year

2. Apply Organic traffic filter/segment or in your case just use the “Non-Paid Search” traffic segment.

3. Select Month view in analytics

4. Export
You should be presented with visitor data that looks as follows:

Treat 0 as 1 so selecting 0-11 = 1 calendar year
By selecting this data you can then transpose it and copy it straight into a report.
5. Transpose data

It should transpose as follows:

Which when pasted into your shiny new report it’ll fill out the YoY data up to the latest full calendar month (or whatever date range you selected.) Check the next link to learn how to build the best long-term search engine optimization strategy.

You can do this with anything you want YoY data for… traffic, goals, bounce rates. Whatever tells your client that YOU are awesome….
